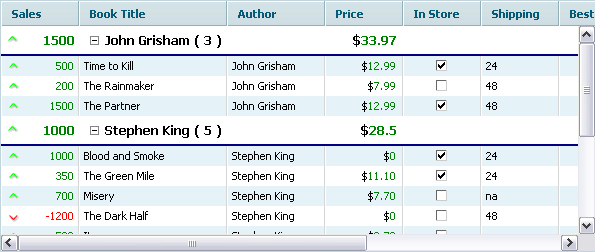
Columns grouping
Functionality described below requires dhtmlxgrid_hextra.js
Beware that grid not oriented on usage of big count of columns, so grids with big count of columns ( >50 ) will be significantly slower than grid with lesser amount of columns. And while this feature allow to creates very wide grids, it may result in slowdown.
In many situations, data shown in the grid contains too much columns to be fully shown on the screen. The scrolls solve problem partially, but they may hide important information from initial view. Columns grouping allows to organize view in such a way that all necessary data will be visible at once. Secondary columns may be switched to visible state with a single click.
For example, we have the following header structure:
grid.setHeader("Sales,Book Title,Author,Price,In Store,Shipping,Bestseller,Date of Publication");

Now we add #collapse shortcut to the header:
grid.setHeader("Sales,{#collapse}2:Book Title,Author,{#collapse}5:Price,In Store,Shipping,Bestseller,Date of Publication");

“Plus” icons allow to collapse and expand the group of columns. The header cell may contain:
any text {#collapse}[size]:any text
[size] here is the count of columns that will be included in collapsable group (including the column with shortcut).
The columns may be forced to be in the collapsed state in the following way:
      grid.setHeader("Sales,{#collapse}2:Book Title,Author,{#collapse}5:Price,In Store,Shipping,Bestseller,Date of Publication");
      ...
      grid.init()
      grid.collapseColumns(3); //only after init (!)

The same functionality can be applied against multi-line complex headers till the border of collapsable columns do not intersect any colspans.


It should be noted that grid's performance is heavily affected by the count of columns. The component can render dataset with huge count of rows much faster than dataset with equal count of columns. So, columns grouping must be used carefully.